

Methods
Overview
We have undertaken a comprehensive review of genetic factors putatively associated with colorectal cancer, catalogued all genetic association studies published in this field and conducted meta-analyses of variants with genotypes available in four or more independent case-control studies, and if these variants had been typed in two large GWAS, these were also included in the meta-analyses. The results of the search strategy and meta-analyses will be regularly updated and published in this internet database (CRCgene). This represents the first attempt to systematically capture all published genetic association data for colorectal cancer and conduct a meta-analysis. The core aim is to provide an up to date systematic review of the state-ofľthe-art across this research field of colorectal cancer genetics for the research community. We conducted a critical review of all published ôcandidate geneö study data, incorporating relevant candidate gene data from GWAS available to us, and then performed meta-analyses of these data. This approach enabled us to summarize available evidence over larger sample sizes, thus gaining greater precision in odds ratio estimates. We have presented these data within a defined statistical and causal inference framework to aid correct interpretation of data.
The broader medium-term aim of this work is to identify genetic variants for which there is robust evidence of influence on colorectal cancer risk. This will help inform future research efforts and identify variants that can serve as a basis for providing risk estimates for population groups. It will also provide new insights into the fundamental biological mechanisms involved in colorectal carcinogenesis.
Literature search and data collection
The first step was to undertake a comprehensive systematic literature review of all current published data on genetics and colorectal cancer. To identify positive colorectal gene association studies we used the Medline database via the Ovid gateway. We cross checked these findings against those listed in the HuGENet phenopedia. Of these papers, first the abstracts, and then if necessary the full texts, were screened for eligibility using the following inclusion and exclusion criteria. The paper must have evaluated the association between a polymorphic gene variant (one with a MAF=0.01 in the general population) and sporadic colorectal cancer. Papers studying only pre-malignant conditions such as adenomas, polyps or dysplastic tissue were not included. In addition, studies concerned with hereditary colorectal cancer syndromes such as familial adenomatous polyposis, hereditary non-polyposis colorectal cancer, juvenile polyposis syndrome and Gardnerĺs syndrome were excluded, as the focal point of this project was sporadic colorectal cancer. All studies needed to relate to human participants; any that were concerned solely with investigating the progression or histological phenotype of colorectal cancer were excluded. Case-control, appropriate cohort and GWA studies were included. The study had to be published in a peer review journal before the 30th of June 2010. For variants that were identified through genome wide association studies (GWAS) the search was repeated and extended for up to the 31st of March 2011. Any research that had only been reported on in abstracts, e.g. presented in scientific conferences yet to be fully published, was excluded. A list with all variants to be summarized using meta-analysis was generated and it was compared to a list of variants that were included in two GWAS (Scotland and Canada). If a variant was found to be included in either of these GWAS, then genotype counts were included in the meta-analysis of this variant.
Statistical analysis
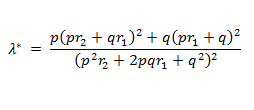
Statistical analysis was conducted using Intercooled STATA, version 11.0. Meta-analysis was performed for all variants with case-control data available from four or more independent samples. We obtained summary crude odds ratios (ORs) and 95% Confidence Intervals (95% CI) for two additive models (var/wt vs. wt/wt and var/var vs. wt/wt), one recessive (var/var vs. var/wt and wt/wt) and one dominant model (var/var and var/wt vs. wt/wt). We applied either the fixed effect model (Mantel-Haenszel method) or in case of heterogeneity the random effect model (DerSimonian-Laird method). Between study heterogeneity was quantified by calculating the Q statistic with a p-value less than 0.05 being the threshold. We also calculated the I2 heterogeneity metric and its 95% CI. Although in some cases we summarized studies that were very heterogeneous, it is recognized that due to the variation in study methods and outcome definitions the meta-estimates should be interpreted cautiously. To assess for any small study effects and for publication bias, we performed funnel plot analysis and tested for significance using the Harbord modification of the Egger test, implemented in STATA (http://ideas.repec.org/a/tsj/stataj/v9y2009i2p197-210.html). We also estimated the power that each meta-analysis had in order to detect a statistical significant effect based on a level of significance alpha=0.05. The sibling relative risk attributable to a given SNP was calculated using the following formula:
Credibility of genetic association
In assessing the credibility of genetic associations, we considered the Bayesian False Discovery Probability (BFDP) (1) and the Venice criteria (2,3). The BFDP assesses the noteworthiness of an observed association. For variants that were found to be statistically significantly associated with CRC risk in any of the genetic models at p-value level of 0.05, the BFDP was estimated using the Excel Calculation Spreadsheet (http://faculty.washington.edu/jonno/cv.html). The BFDP threshold for noteworthiness was set up to be equal to 0.20, based on the assumption that a false discovery would be three times more costly than a false non discovery. We chose to calculate BFDP values for 2 levels of prior probabilities: at a medium/ low prior level (0.05-10-3) that would be close to what would be expected for a candidate gene and at a very low prior level (10-4 to 10-6) that would be close to what would be expected for a random SNP. In regards to the Venice criteria, we operationalized the criterion of volume of evidence on the basis of statistical power to detect an association of the desired magnitude: A, 80% or more; B, 50-79%; C, <50%. For replication, we used the I▓ criterion proposed by Ioannidis et al (2). For protection against bias, we considered that complete reporting was problematic. The phenotype definition was addressed by our inclusion criterion ľ namely that cases would have newly incident colorectal cancer. In general, genotyping error rates are low (4), and the criterion of replication across studies in part addresses potential concern about variation in genotyping quality between studies; some genotyping issues are discussed in relation to specific findings below. While population stratification may impact on gene discovery (5,6), the effect on the magnitude of association in general appears to be small (7,8). We classified the genetic associations in three categories according to the findings after the BFDP analysis and the application of the Venice criteria. Associations were classified as positive if they fulfilled the following criteria: (i) they were statistically significant at a p-value level of 0.05 in at least two of the genetic models, (ii) had a BFDP less than 0.20 at least at the p-value level of 0.05, (iii) had a statistical power greater than 80% and (iv) had an I2 less than 50%. As less-credible positive were classified the associations (i) that were statistically significant at a p-value threshold of 0.05 in at least one of the genetic models, but (ii) their BFDP was greater than 0.20 and (iii) their statistical power was between 50-79% (I2 ranged from 0% to 89% for this category, but this criterion was not taken into account for this category). All other associations were classified as negative.
Model free approach
For those SNPs that were identified as true positives after applying the BFDP and Venice criteria, we applied the model free meta-analysis approach as described by Thompson et al (9). This model uses a maximum likelihood estimator, assumes a fixed effect meta-analysis and is similar to a bivariate meta-analysis of the effects for the heterozygotes and variant homozygotes. It gives an estimate of the lambda, which represent the underlying genetic model (and it represents the heterozygote effect as a proportion of the homozygote effect), with its confidence interval limits. If lamda's confidence interval is too wide, then there is not enough power to estimate lamda. The value of lamda is not restricted. Values equal to 0, 0.5 and 1 correspond to the recessive, additive and dominant genetic models respectively. Values greater than 1 or smaller than 0 suggest heterosis, which is when the risk of the heterozygotes is higher, or lower, than the risk of either homozygote genotypes. However, heterosis is relatively uncommon and lamda values greater than 1 or smaller than 0 could represent chance fluctuation reflecting low statistical power to estimate the magnitude of effect for heterozygotes.
References
- Wakefield J. A Bayesian measure of the probability of false discovery in genetic epidemiology studies. Am J Hum Genet 2007; 81(2): 208-27.
- Ioannidis JP, Boffetta P, Little J, et al. Assessment of cumulative evidence on genetic associations: interim guidelines. Int J Epidemiol 2008; 37(1): 120-32.
- Khoury MJ, Bertram L, Boffetta P, et al. Genome-wide association studies, field synopses, and the development of the knowledge base on genetic variation and human diseases. Am J Epidemiol 2009; 170(3): 269-79.
- Pompanon F, Bonin A, Bellemain E, Taberlet P. Genotyping errors: causes, consequences and solutions. Nat Rev Genet 2005; 6(11): 847-59.
- Marchini J, Cardon LR, Phillips MS, Donnelly P. The effects of human population structure on large genetic association studies. Nat Genet 2004; 36(5): 512-7.
- Balding DJ. A tutorial on statistical methods for population association studies. Nat Rev Genet 2006; 7(10): 781-91.
- Wacholder S, Rothman N, Caporaso N. Population stratification in epidemiologic studies of common genetic variants and cancer: quantification of bias. J Natl Cancer Inst 2000; 92(14): 1151-8.
- Ioannidis JP, Ntzani EE, Trikalinos TA. 'Racial' differences in genetic effects for complex diseases. Nat Genet 2004; 36(12): 1312-8.
- Thompson JR, Minelli C, Abrams KR, Thakkinstian A, Attia J. Combining information from related meta-analyses of genetic association studies. Appl Statist 2008; 57(1): 103-15.